
What the AI Labour Market Research Means for Compliance and Safety Teams
The research says less than the headlines. Anthropic's March 2026 study found no measurable rise in unemployment for the most AI-exposed United States occupations since late 2022, and only a barely significant slowdown in hiring for workers aged 22 to 25. Australia's own July 2026 analysis found no evidence of AI-driven upheaval here. For a compliance team the usable finding is the gap: AI covers a fraction of the tasks it theoretically could.
Create a free account
Contact SalesPeople forward me these studies, usually with a subject line that says more than the paper does. I read them the way a product person reads a benchmark, looking for the part of the method that decides the number.
So this is the evidence post. What the research actually measured, what it found when you read past the headline, what the Australian data says, and which findings do not survive the trip here. The governance side of the same subject is in what AI governance means in a safety-critical business; this one is about the numbers.
What the Research Measured, and Where.
The paper being sent around is Anthropic’s, published on 5 March 2026 and written by Maxim Massenkoff and Peter McCrory. It introduces a measure called observed exposure, which asks, of the tasks a model could theoretically speed up, which ones are actually seeing automated use in professional settings.1
The method matters more than the finding. It combines the O*NET database of tasks for around 800 occupations, Anthropic’s own record of how Claude is used, and task-level estimates of theoretical capability from earlier academic work, then tracks employment outcomes in the United States Current Population Survey.1 Every occupation, every task and every worker in it is American. There is no Australian cut.
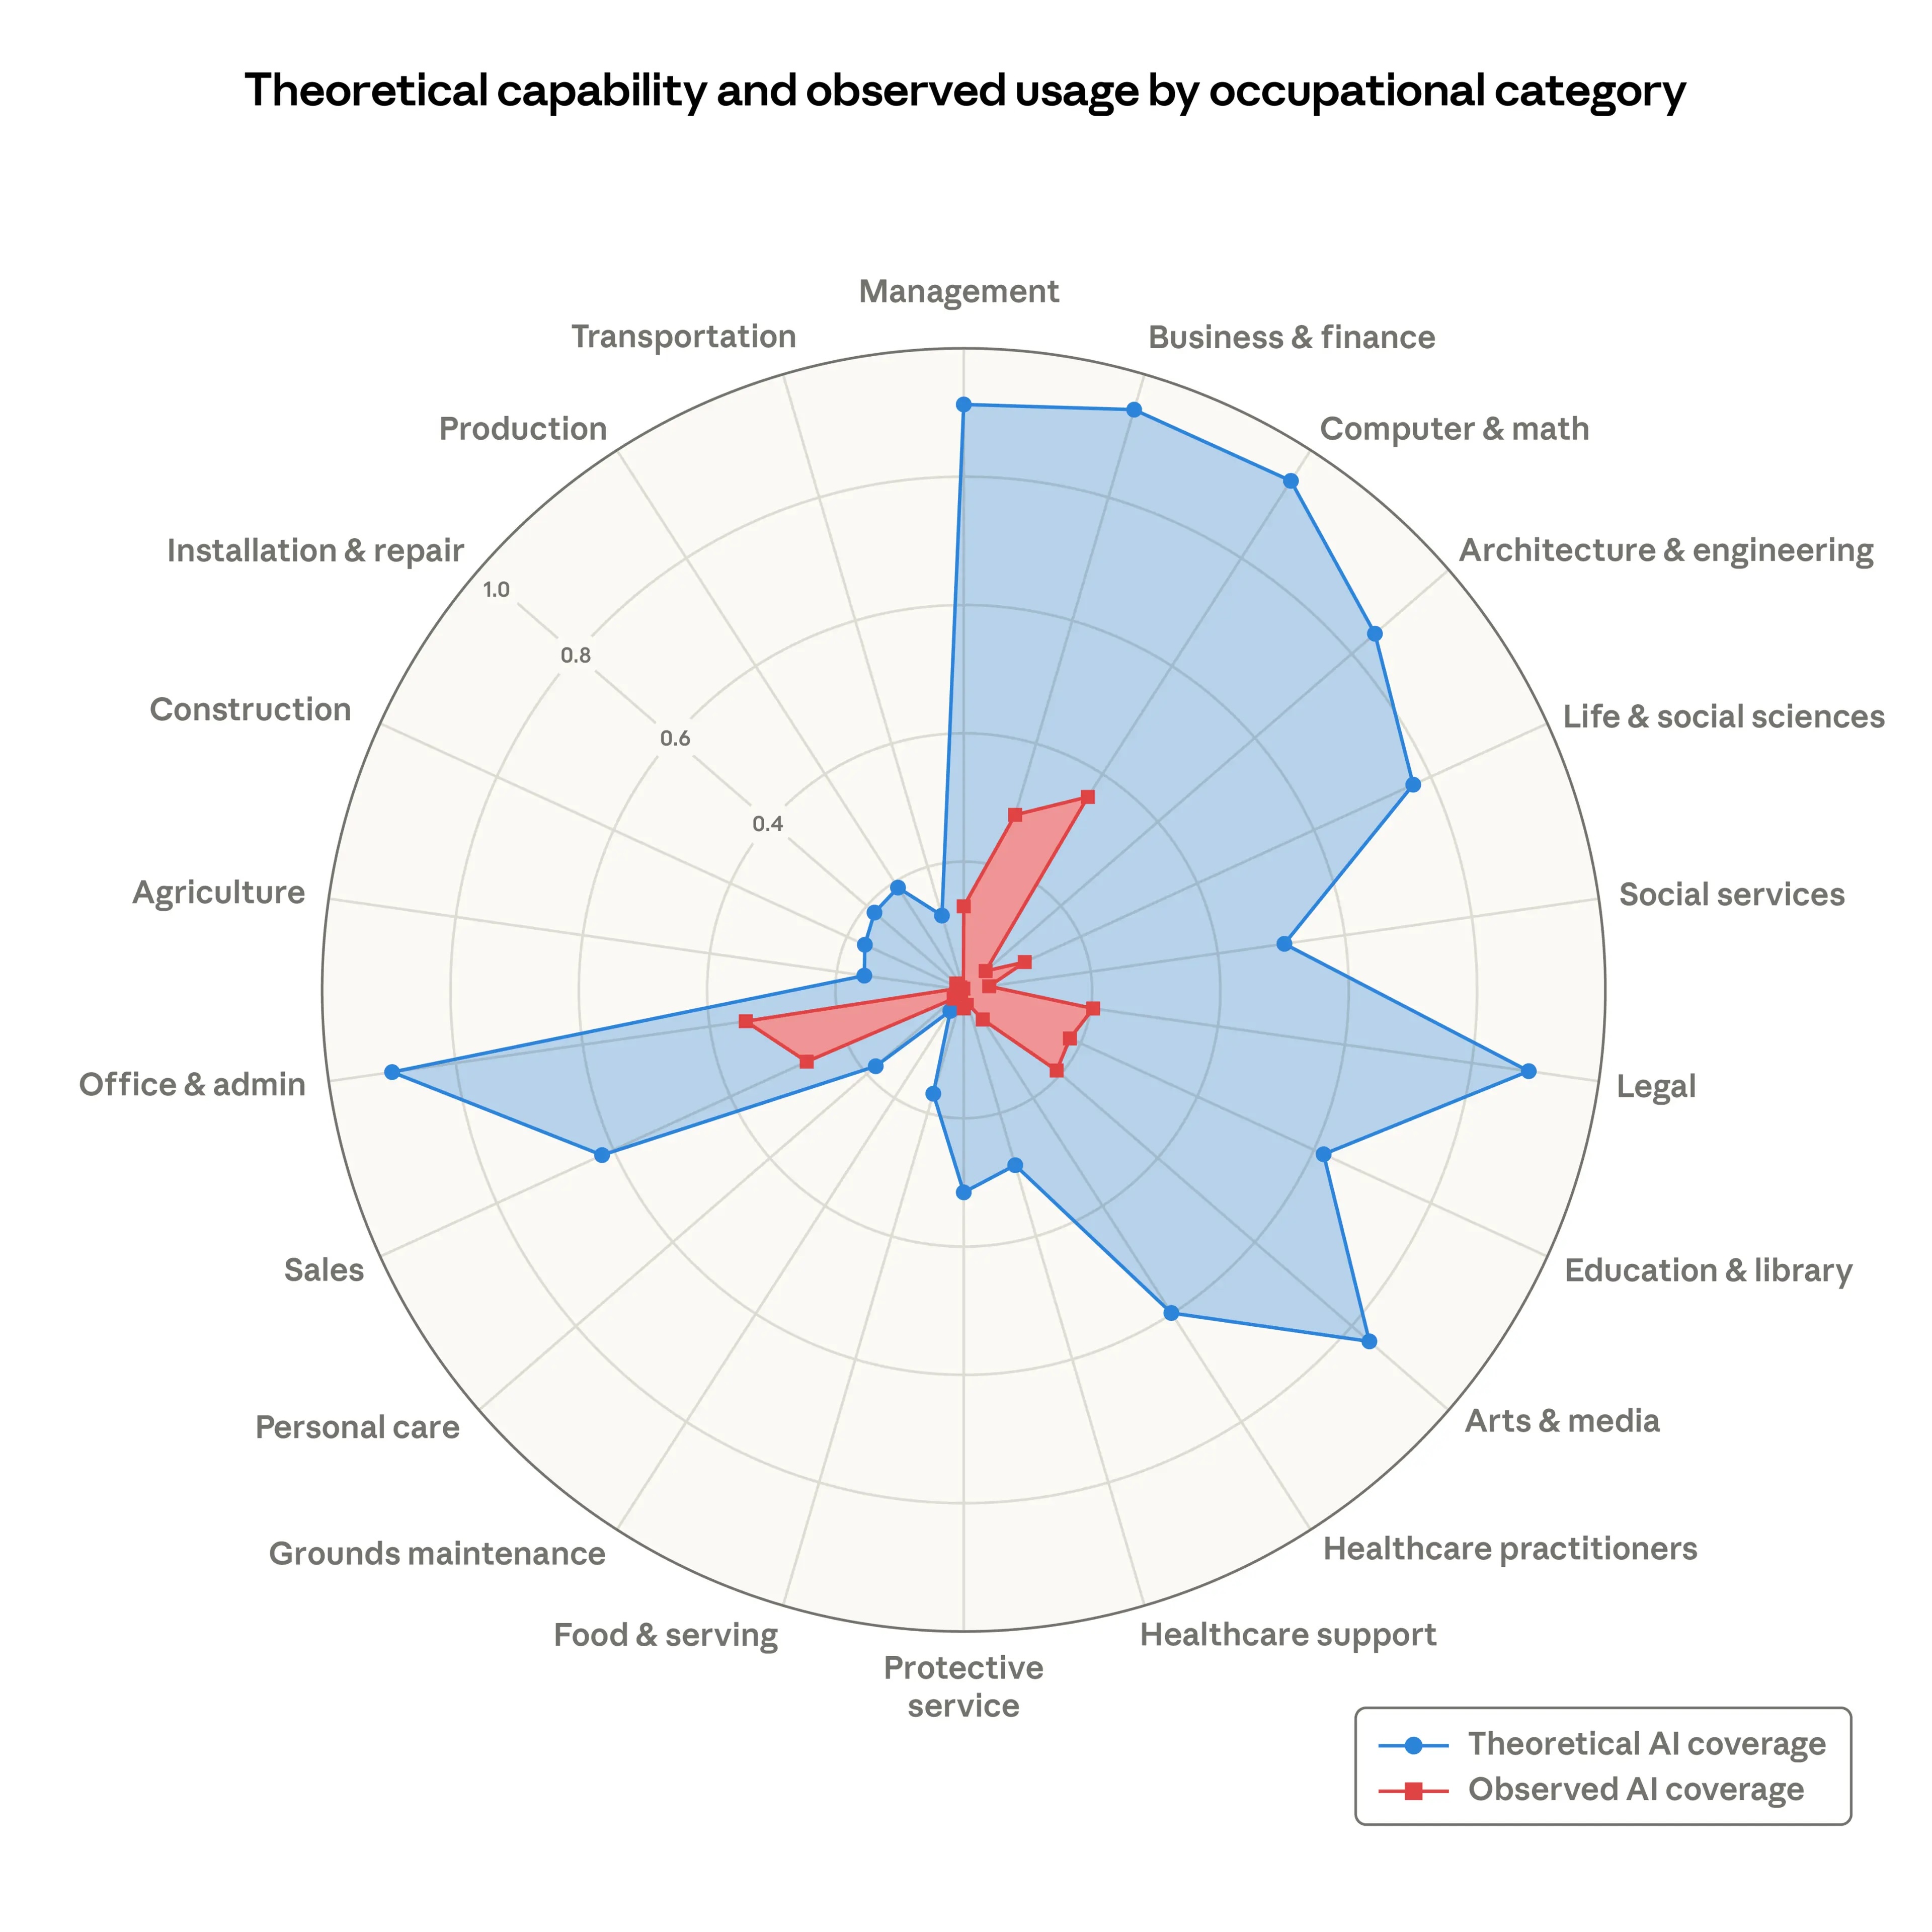
The headline result is the gap, and it is wide. Claude covers 33% of the tasks in the computer and mathematics category, against a theoretical ceiling of 94%. The most exposed occupation of all is computer programmer at 75% coverage, then customer service representatives, then data entry keyers at 67%. At the other end, 30% of workers have zero coverage, because their tasks barely appear in the data at all.1
What It Found About Jobs, Stated Carefully.
Two findings, and both are smaller than the coverage they received.
On unemployment, the study compares the most exposed quarter of workers with the unexposed group since ChatGPT’s release in late 2022. The average change in the gap, the authors write, is small and insignificant, and the effect is indistinguishable from zero.1
On hiring, there is one real signal. For workers aged 22 to 25, the rate of starting a new job in a highly exposed occupation fell about 14% compared with 2022, while the rate into less exposed occupations held steady at 2% a month. The authors describe that as just barely statistically significant, and note there is no such decrease for workers older than 25.1 It is a hiring-rate finding about new entrants, not evidence that anybody lost a job.
Australia now has its own version, and it is the one worth reading if you work here. The Department of Employment and Workplace Relations published an analysis in July 2026 covering 355 occupations from February 2015 to February 2026. Its first key point is that there is no evidence to date of broad labour market upheaval driven by AI in Australia. Between November 2022 and February 2026, employment in the most-exposed fifth of occupations grew 5.6%, against 9.5% in the least-exposed fifth, and the model implies employment about 2% lower than trend for an occupation one standard deviation above average exposure.2
Then the department does something a vendor blog would not: it says the finding is not statistically significant when two alternative exposure measures are used, or when the COVID-19 period is excluded, and should be read as justification for ongoing monitoring rather than clear evidence.2 That is the honest state of the evidence, and anyone quoting the 5.6% at you without the sentence after it is selling something.
Where Your Industry Actually Sits on the Curve.
This is the part that changes a decision, and it is all Australian.
The Australian Bureau of Statistics surveyed nearly 7,000 businesses for the 2024-25 financial year and found 12% reported using AI in their workplace. By industry the spread is enormous: 38% in information media and telecommunications, 24% in professional services and in financial services, 18% in mining, 6% in construction, and 1% in transport, postal and warehousing.3 If you run compliance for a construction business or a logistics operation, that is your starting line.
Jobs and Skills Australia reached the same place from the task side. Across 998 occupations it found 4% of the workforce in occupations with high automation exposure to generative AI, and 79% with low exposure.4 And the National AI Centre’s monthly tracking survey of at least 400 small and medium businesses put adoption at 43% across the December 2025 to February 2026 quarter, with construction and agriculture below 30%.5
Put those beside the exposure data and the practical conclusion is sharper than any of them alone. The occupations with measurable AI coverage are office, admin and programming. The shortage that is actually hurting Australian sites is licensed trades and supervisors, which every one of these measures places near zero. AI is not going to fill that gap; how a skills shortage becomes a safety risk is a separate problem with separate controls.
Why the Gap Is Not Only a Technology Lag.
The most useful line in the Anthropic paper is an aside. Tasks that are theoretically feasible may be slow to diffuse, the authors write, because of legal constraints, specific software requirements, human verification steps, or other hurdles.1
Read that as a compliance professional and part of the gap stops looking temporary. The human verification step is not friction to be engineered away. It is the control, and there is thirty years of research on why it stays.
Automation bias sits at the centre of that research. A decision aid raises the overall quality of the work and, in the same movement, costs its user the ability to spot what the aid itself got wrong.6 Parasuraman and Manzey, in Human Factors in June 2010, put the sharper edge on it: expertise does not protect against the effect, instruction does not remove it, and a team goes wrong together as readily as a person does alone.7
So in work where a wrong answer reaches a person on site, some of that blue area is never going to turn red, and that is the correct outcome rather than a failure of adoption. Australian businesses have half-worked this out already: among small and medium businesses using AI, the most common safeguard is checking outputs before they affect customers, in place at about half of them, while transparency with customers and formal complaint processes lag well behind.5
What Does Not Travel From Europe.
Two numbers get quoted at Australian teams and both need a border check.
The first is the AI governance hiring story. A United Kingdom skills report covering 122 job postings on four job boards in the third quarter of 2025 found AI governance, risk and compliance the fastest-growing category of advertised AI roles, and names EU AI Act compliance as the driver.8 Australia has no AI Act. The National AI Plan of 2 December 2025 settled that the regulatory approach will build on existing legal frameworks, with regulators keeping responsibility for AI harms in their own domains.9 Take the observation that oversight roles are growing; leave the driver in Brussels.
The second is the World Economic Forum’s figure that 39% of workers’ existing skills will be transformed or outdated over 2025 to 2030, with 63% of employers calling skill gaps the biggest barrier to transformation. That comes from a survey of over 1,000 employers across 22 industry clusters and 55 economies, published January 2025.10 It is a good number and it is a forecast of what employers expect, not a measurement of what has happened. Keep those two categories apart on the slide.
What to Do With This on Monday.
The defensible position from all of it is narrow, which is what makes it useful. The measured coverage sits in document handling, drafting and data entry. That is the administrative layer around compliance work, not the judgement at the centre of it, and it is where to start.
Start there with the check built in rather than bolted on. When we shipped our AI tools in June 2026 we made you define the review criteria first, let you test an agent against a real sample document before it goes live, show a contractor the criteria their answer will be assessed against, and record every review in a log.11 None of that is about the model being clever. It is about the verification step the research says is not going away. If you want the capability list rather than the evidence, what our AI does sets it out, and your compliance and legal team should be asking every vendor the same questions.
The teams I watch get this wrong in one specific way: they read a study about American programmers and reorganise around it, while the thing actually changing their week is a shortage of licensed operators. Read the Australian numbers first. They are less exciting and they are about you.